June 18, KPN hosted an internal meetup to showcase some of the analytics solutions with Splunk for service and performance management, as well as automation of different processes. Two of our Itility data scientists presented there.
 Bas Cloin presented the automatic log classifier solution – this was developed to deal with the large number of errors present in application logging.
As a matter of fact, the number of such errors can easily exceed what an engineer can process and troubleshoot.
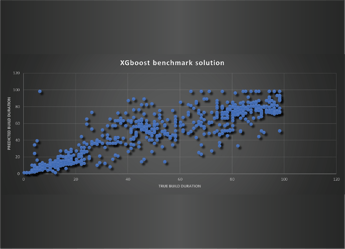
In addition, many of these errors do not require immediate action and can thus be considered false positives. At Itility, we created a solution in which error messages from application logging are fed into an algorithm written in R. To allow R sorting those messages into relevant and irrelevant, we used a text mining approach, where error messages are broken into counts of individual words. Next, we used a boosted ensemble of decision trees to classify them and pass the relevant ones (the red alerts) to the responsible engineers. Since this approach is as effective as the training data used to build it, it was important to us that the messages directed to engineers as red alert are re-evaluated and added to the training data set. Such feedback loop will result in more accurate classification in future. This approach was used successfully for both logging from Splunk itself, as well as logging data sent from other applications to Splunk, such as vCenter.

Next, Jędrzej Świeżewski presented apps for Operational Performance and Puppet. The Operational Performance app provides an overview of the server infrastructure for support teams and highlights the points which require immediate attention. Furthermore, detailed drill down of issues can be done in place.
The Puppet app was designed for managers to give them insight into teams’ performance in the pursuit of orchestration. Both of those applications take advantage of the possibilities that Splunk offers, namely handling large amounts of hot data and the flexibility in customization of the dashboards. With interactive features and tailored graphical representation of data, users can immediately grasp the information they are presented. Furthermore, live updates of the data allow engineers to view the current state of the infrastructure and to deal timely with the occurring problems.
Other presentations covered a variety of topics – from a predictive capacity management app, a service orchestration app, a data ownership app, to a key performance indicator (KPI) app. As each of those speakers took the stage they revealed the wide spectrum of cases where descriptive analytics can be beneficial. They covered alerts about the approaching servers’ capacity, requirements for software updates, comparing team performances, data acquisition, alerts about the outliers and more. Seeing examples of dashboards on screen, the audience could appreciate various setups and designs implemented to help the user.
Summary
The overall picture that emerged from this meetup was that using a big data tool such as Splunk has several major advantages for controlling and running the company’s operations. Important is the automation of data processing, and easy identification of the most urgent matters that need to be tended to, making use of state-of-the-art machine learning techniques if beneficial. Predictive properties of such approaches could allow identifying problems even before they occur, resulting in significant reduction of running and repair costs. Graphical presentation of the data allows drawing business value from the data with ease, even by less technically experienced users.
Want to think along on the possibilities? Sign up for the next hackathon.