Understanding Data Science can be hard, even for Data Scientists themselves. But hard things exist so Itilians can make them simple ;-).
I have heard several questions over the years, such as:
- What is the difference between a Data Scientist and an Engineer?
- Can you explain how a Data Scientist solves a problem?
- How can Data Science be used to provide business value?
This article will try to answer these questions, with the following goals:
- Encourage you in spotting business opportunities by providing a fun Data Science example
- Learn the similarities and differences between solutions of 4 different ‘stereotypical’ Itilians
- Understand what a Data Scientist does, and when you might want to ask for his or her help.
 I will explain the project of finding the optimal warehouse layout, by using 4 Itility stereotypes, based on Insights.
- The “Red” Project Manager (PM)
- The “Yellow” Software Engineer (SE)
- The “Green” Business Analyst (BA)
- The “Blue” Data Scientist (DS)
Since finding the best layout of a warehouse is a decision problem (Where should the shelves be? Where should the products be?), this problem is a good match for a Data Scientist. However, other roles provide excellent solutions as well, which is why these are also discussed. Besides that, this lets you see the world from multiple angles, which is also a valuable trait for any of us.
Let’s introduce the problem. Suppose we have a potential new customer that produces and distributes fruits and desserts, with the name “Ice-cream Knowledge, Elderberries and Apple-pies”. Of course, IKEA needs us to manage their IT environment, but they also struggle with finding the optimal layout for their warehouses. IKEA thinks they can save a lot of money by restructuring their warehouses by minimizing the sum of the set-up costs (implementing the solution) and the warehousing costs (minimal average order picking time) over a time period of 5 years.
Of course, Itility likes this interesting problem, and decides to ask 4 different Itilians to propose a solution. Each one receives a short explanation and a small amount of data from the IKEA manager:
“Currently, multiple trucks park near the exit of the warehouse. The employees start picking orders by walking inside the warehouse with a large box, collecting up to 5 different products from the shelves, and storing the box with products in the truck. We want to reduce the time they walk around in the warehouse, because time is money. One rule should not be broken: The storage space must be equally distributed between the products. I have included our 5 products and 6 of our most delivered boxes:”
| Products | Most delivered boxes: |
| (A) Apple pie | {Apple pie, Brownie, Chocolate Ice-cream, Dundee cake} |
| (B) Brownie | {Apple pie, Brownie, Chocolate Ice-cream} |
| (C) Chocolate Ice-cream | {Chocolate Ice-cream} |
| (D) Dundee cake | {Apple pie, Brownie} |
| (E) Elderberries | {Elderberries, Apple pie, Chocolate Ice-cream} |
Each of the 4 Itilians comes up with a solution that fits their role, which you can find below.
(Keep in mind that the proposed solutions are a bit over-exaggerated and/or narrow-minded, but this is done in order to explain the general thought process behind them much better.)
The Red Project Manager
Goals of the Project Manager:
- Keep it simple, well organized and customer focused
- Reduce set-up (project) costs as much as possible
- Solution should be a building block that can be expanded upon with new projects
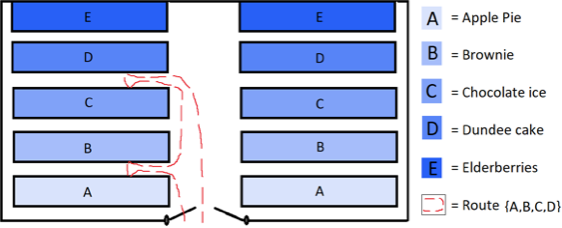
The Project Manager has a clear idea on how the warehouse layout should look like. It must be well structured, so everyone will immediately know where the product is they are looking for, and this is done by sorting the products in alphabetical order from the entrance of the warehouse. Also, Itility should be able to execute the solution relatively quickly, so the same rectangular shelves are used to keep the implementation costs low.
Furthermore, the PM is looking at other customers for inspirations, and chooses a floor plan that is used often in warehouses all over the world. It is also convenient to follow up on this project. Firstly, because the initial costs are low there is still some room in the budget of the customer. Secondly, the shelves are literal ‘building blocks’ that can easily be deconstructed and assembled to form a different layout.
So after a while, when patterns start to build over time, a new project can be started to improve the existing solution. The customer seems very happy with this solution as the advantages are very clear, and the risk of failing is reduced to a minimum.
Solution of the Project Manager:
The Yellow Software Engineer
Goals of the Software Engineer:
- Automate as much as possible
- Reduce warehousing costs as much as possible
- Solution should be of high quality and modular
The Software Engineer promotes a solution where robots are handling the order picking, which is of course future-proof and a very cool and innovative solution. Also, robots can be faster and more cost-efficient than humans, which will reduce long-term warehousing costs to a minimum.
It is important that the solution is sustainable and scalable, which means the design consists of several components. This will also imply that the solution is “High Available”, which means that even if one of the components (such as a rack or a robot) breaks down, there will be no panic as the warehouse can function as well as before the breakdown.
It might take a while before the development of every component is finished. But when this is achieved, the solution can be tested in an acceptance environment to observe that it is working as intended. When this test is passed, it can be taken into production. The automated order picking will reduce both uncertainty and costs to an absolute minimum, which will benefit the customer enormously.
Solution of the Software Engineer:
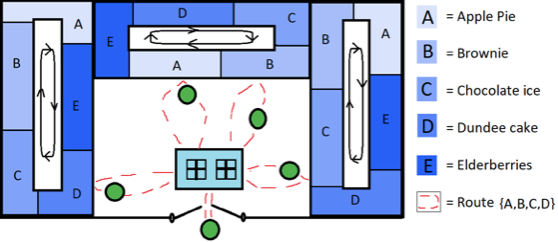
(For those of you who do not understand my drawing skills):
There are 3 large racks holding the 5 products, and they keep rotating products infinitely. You can say that the shelves are standing on a conveyor-belt, so the products keep on going in circles all the time. Furthermore, there are 5 robots, of which currently 4 are picking orders and placing them in the central area in the middle, while 1 of the robots is delivering the orders to the trucks.
The Green Business Analyst
Goals of the Business Analyst:
- Analyze the data and incorporate the knowledge of domain experts and the customer
- Reduce the set-up and warehousing costs to create an interesting business case
- Solution should be measurable and added value must be clear
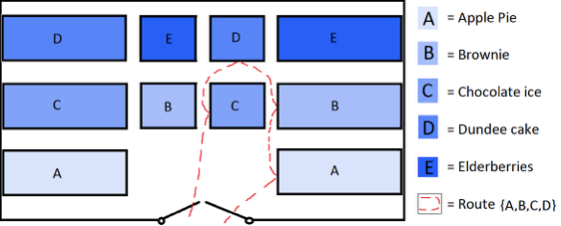
The Business Analyst is looking for a solution that considers all the useful information that can be found. In this case, the most delivered boxes provide valuable information, as it can be deduced which products have a high probability of being picked {A -> C -> B -> D -> E}. It would be smart to put products being picked more often, closer to the exit of the warehouse.
This reduces average travel time and therefore also warehousing costs. Also, the set-up costs are kept low by using a nice and easy-to-build floor plan. Communication with the domain experts and customer leads to a lot of valuable insight. For instance, the aisles should be wide and there should be a lot of them, because those are strong factors for reducing picking time when the warehouse is crowded.
Also, a large space in front of the exit would be useful as every box has to cross through there, and you do not want a queue to form near the exit. Next, a meeting with the stakeholders is planned to explain the solution, and to show that the following solution is highly efficient by comparing it to a few other layout proposals.
Solution of the Business Analyst:
The Blue Data Scientist
Goals of the Data Scientist:
- Retrieve hidden information in the data by using algorithms
- Find the optimal warehouse layout for the given problem, and explain why it is optimal
- Solution should be flexible and adjustable by the customer
The Data Scientist starts by thinking about the possibilities. Some sample solutions will be thought off (like those of the PM, the SE, and the BA) and what their advantages and disadvantages are. After this is done, the most valuable information is picked from each solution to use in a model (structure from the PM, high quality from the SE, insight and analysis from the BA).
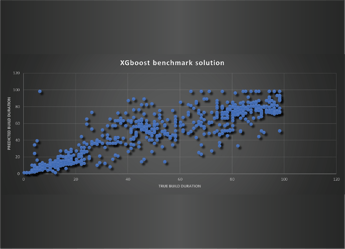
Furthermore, the DS tries to get more information about the data that is not observed immediately. For instance, the most delivered boxes are analyzed with an algorithm called “Frequent pattern mining”, to obtain information about which products are often bought together. The following is discovered: “E is only bought separately”. “If A is bought, B is also bought”. “C and A are closer related than C and B”. The info obtained is incorporated in the model, by including rules that ‘E should be close to the exit but not to other products’, ‘the closer A and B are, the better the solution’, etc.
Once every piece of helpful information is gathered, the model is constructed. This can be done using various techniques, but in this case a simulation model is chosen. This means that we start with a complete empty warehouse and put shelves and products in there randomly. By calculating the value of the different rules that need to be optimized (structure, quality, insight, frequent patterns, average walking distance per box, etc…) the solution is scored.
So for instance, the complete random solution has a score of 1. Then, by reshaping shelves, moving around shelves and switching products in the simulation, the solution is improved step by step. After a while we find a solution that scores 30, then 44, then 50, etc.. We keep improving until no improvement can be made anymore.
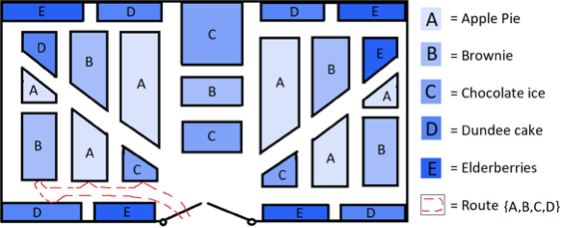
Depending on the type of algorithm used, the Data Scientist can now prove that either the optimal solution is found with certainty, or that we are very close to it. To make sure the customer can repeat this process any time, a dashboard is created where the rules are automatically created based on the data, the model can be run, and the customer is also able to change the rules based on their needs. The floor plan that follows from the simulation based on the current rules and data is the following.
Solution of the Data Scientist:
Conclusion
There are four very different and interesting proposals on the table. The customer sees advantages and disadvantages in all of them. However, he is not yet quite sure which solution he should choose. The Data Scientist is able to help, because besides solving puzzles, another one of his core competencies is to visualize data.
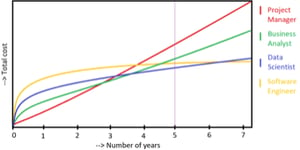 A graph is constructed where the total costs are plotted over time for each of the proposed solutions. As you can see, each solution has a certain timespan in which it will yield the minimal total costs. The PM proposed a solution which has the lowest cost up until the 3rd year. But then the solution of the BA becomes more promising. From year 4 till 6 the DS has the lowest cost, while in the long run the SE has the best proposal.
The customer asked to minimalize the costs over a time period of 5 years, and since the solution of the Data Scientists is optimized on this time period, the customer chooses this solution. He is happy that he can save a lot of costs, and believes he received the best solution possible due to the explanations and visualizations provided to him. This customer is very satisfied with Itility, and will come back to us for sure.
At the beginning of this article, you might have wondered what this bold text was all about… Well, I hope it became clearer while you were reading, and hopefully you noticed that these words are keywords in the language of Data Science. If you get the question; “Do you know what a Data Scientist actually does?”, you are now able to answer in two ways. Either explain it by means of an example like I did here, or try to formulate it more generically by using sentences where the bold words occur a lot.
Want to try out what it's like to be a data scientist? Join one of our machine learning hackathons. During the meetups we will use all kinds of tools (Splunk, R, Azure ML studio etc) to play around with these topics and really create something tangible during the meetup as a joint team effort.
So: no theory, only practical examples and the opportunity to learn from each other. Pizza and drinks included of course!