
Data can help forecast customer demand, predict quality or maintenance. You can get value from data in your organization. A structured process to proof value with data helps you to start your data journey.
In one of my previous blogs I discussed why you don't need to start with a data platform. So, where should you start? Our belief (and experience) is that starting with small but real experiments is important. We call this 'Proof of Value'. In a new series of blog posts, we present our approach and lessons learned to help prevent you from running into any pitfalls.
The first challenge in starting your data journey is where to focus the effort on – in order to show the value of data in your organization. This blog focuses on how to start, to investigate opportunities and to choose where to focus the first energy.
Get to know your value
Your journey needs to start with understanding what opportunities can be found in your organization. If you are coming from a data or an IT background this means finding the right people in the business that understand the business challenges, priorities and opportunities. Generally, this means talking to the teams that are close to the customer, or the ones involved in logistics, support, or product development.
A good starting question to talk to your colleagues is to ask where they see room for improvement. Do not bring data to the table immediately. Just understand their daily struggles. What are they doing to improve their way of working, quality or decrease downtime for customers? Then start to listen and stay curious and keep asking 'why' a lot. It might sound daunting at first, but very soon you learn that there are a lot of opportunities floating around your company.
Ranking initiatives
Your next challenge is to choose the initiative where you can make the most difference (the biggest bang for the buck). Since can’t start them all at once. Our approach is to create a ranking matrix based on six different criteria. Let's go through them.
1. Express value in concrete numbers
We always start with the business value. Find a way to capture the value of a new initiative. Instrumental in defining the value is to steer away from general terms like quality or speed. Be as precise as possible. Can you reduce downtime for your customer? Define how much that is. What percentage of machine failures could you have prevented last year? How much money does that save? How much more time would your colleagues had for other work? For this criterion it is important to look at concrete value. This helps in later steps in comparing value across many initiatives.
2. Justifying your data engineering and data science resources
To check if the initiative fits your data journey, we have two criteria. First, we estimate to what extend the value comes from data engineering. Building a data pipeline will come at a cost, the value such a pipeline creates should outweigh these costs. Of course, for the right initiatives there is a clear value in having a repeatable process embedded in the organization. Cases that are more ad-hoc or cases based on one-time analytics will have a low score for this criterion.
Similarly, we estimate the level of value created from data science techniques. Not only does this help to rank, but also to decide which experts should join an initiative.
3. Data data data
Next step: data availability. Without actual data to build a pipeline and model, there is no point in starting. Of course, a lack of data is not always a problem when ranking an initiative (once you know you need data, you can work on making it available). However, when you want to start soon and quickly, some data should be there. We also gauge what the quality of data flow is. Without a clear and standard data inflow, building a successful valuable case that runs 24/7 can become quite the challenge. Imagine that fetching unstructured excels from someone's email folder daily is not going to turn into a valuable business solution in short term.
4. Pressure cooker approach
Before we discuss the next criteria, some explanation about our approach is important. We really believe that showing value means to work in a short ‘pressure cooker’ kind of way. Our success factors are that we work in small teams, with a clear goal, and a challenging deadline. Not only is this important inside the team: it creates focus and a drive to succeed. But also outside the team it shows traction, a sense of accomplishment and keeps people interested in the actual results.
For our ranking criteria we have added the availability of a domain expert. Working with the small pressure-cooker team means that the team needs to have easy access to our domain expert. The only way to reach results fast is to be able to immediately ask questions, and together understand the data and review analysis results. We see the domain expert as part of the team. This is the best way to create happy customers in the end.
This means that local, close-by initiatives are often better to get started - even if the value of other initiatives might be bigger.
5. Define realistic goals
Another ranking criterion is the feasibility of implementation. This is one where you involve the team. The team should believe in using the pressure cooker approach as well. If there are too many hurdles to quickly show results this is an important dissatisfier. Sometimes the value is great, but early in your data journey it can remove all enthusiasm and motivation if the challenge is too large. Not being able to show the actual value if the case is not feasible is also a risk, as you might burn precious team effort.
6. Running it
Finally, the last ranking is about looking ahead after a successful implementation: will the value come from operationalization? A one-time effort is nice, but what better than realizing the potential of the solution on a daily basis? For that we rank if the value comes from embedding the operational solution into the organization. This seems obvious, but there are enough cases that only need a one-off data analysis. Working on a solid data strategy means a mindset of wanting to continuously and repeatedly solve problems. Predicting maintenance of your products is something you want to do everyday. Similar for forecasting production quality based on different parameters. Such examples will sell your data strategy throughout your company.
Putting it all together
The best way to rank your data initiatives is of course to show and discuss the criteria assessments. We do this in the form of a PowerPoint slide or excel sheet.
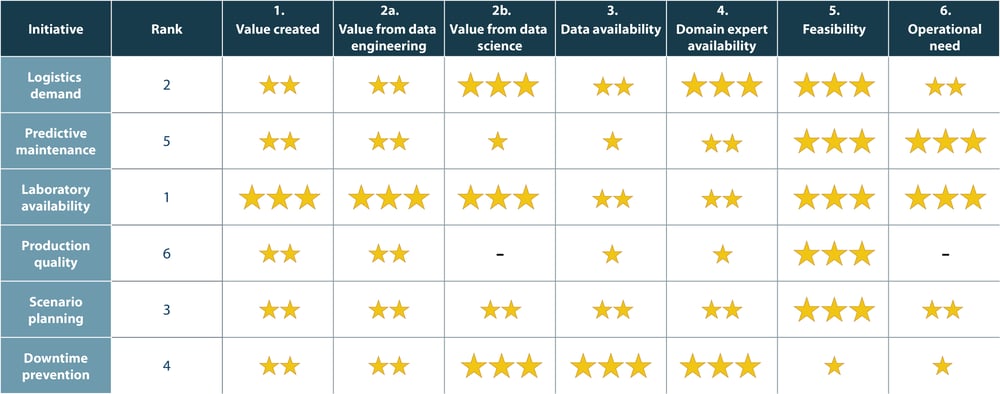 Visual of data initiatives ranking by means of criteria assessment
As you are on a journey and possibly changing your organization along the journey based on the results, reviewing your ranking with different stakeholders is important. To involve them better you can also capture priorities of your stakeholders in the same overview. This way choosing the most promising case involves the right people and builds up support and sponsorship throughout the company.
With this approach you'll have made an important step into your data journey. Next step is to really execute and show the first actual value. We will share more about our approach and lessons learnt in the next blog. This will guide you through the agile approach, team composition and how to make the pressure cooker cook to perfection.