
A burning question a lot of businesses are dealing with is: how to transform data into value? Even though you might not know it, every one of us has already done it.
It begins when you are a baby, because you are born into a world you know nothing about. You start developing your senses in order to understand the environment around you. Starting to smell the same adults in your environment who care for you. When you open your eyes, you see them waving and smiling. After a while you recognize their voices, understand what they mean when they talk. Before you know, you are talking back to them. You can now make more sense of the world around you. You learned a lot from your parents and eventually use all your senses to their fullest extent.
You could say that a data scientist relives his childhood over and over again. You start in an unknown environment, which is often represented as a bunch of unstructured data. Then the learning process starts: looking at samples of your data to recognize some features about it and learning from experts. After a while you understand what the data can tell you, and when you work with it long enough you will know how to communicate with it. Eventually, you will evolve into an educated individual and are able to turn data into value.
To get a better understanding of how a data scientist transforms data into value in practice, I will use an example of capacity management for an IT stack.
1. Data flow
Your data journey begins with the following question: “Can you help out with Capacity Management for a Stack?”. This means both good and bad news. The good news is that the question is quite clear. You are tasked to create something that leads to smart allocation of resources which will save huge amounts of money for your customer. The bad news is that you might have little knowledge on how to get there. Where is my data? What do I need? How do I start? To tackle these questions, you follow a strong and proven strategy: solve the big problem by solving a set of small problems, one step at a time. Like a baby, which first learns to hear, then understands some words, and finally tries to talk back.
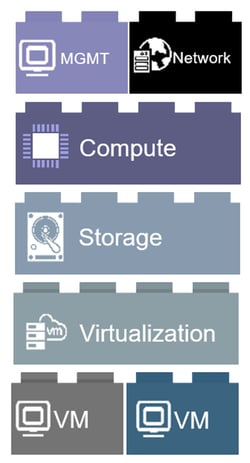
So let’s start with the first step: listening. It is smart to attend a training about IT Stacks, to get familiar with the concepts within this domain. You learn that the Stack of your customer consists of Compute, Virtualization, Network and Storage.
Now that you have some background information, you should decide on the tool(s) to use. Think about what needs to happen to make the customer happy. In this case, it is important to combine different data sources together, answer questions from the customer and being able to visualize results in a short amount of time. Since Splunk is strong in handling ingestion of the data (Data Engineering), as well as in advanced computations and visualizing the results (Data Science), it is a great tool for the job.
The next step is to collect the actual data from multiple sources. To handle this gracefully, create a separate bucket with data for every part of the IT Stack (it is just like arranging encyclopedia’s A-D E-H etc.. to quickly find a word you are looking for). Resulting in fast, convenient and structured data handling. Also, you should think about structuring the data by fields within this bucket (just like in an encyclopedia, it first states the word and is followed by a description, but now we state a field, followed by data). It is convenient to use naming conventions, so everyone understands what the data means when they retrieve it. Just like we developed languages in order to let babies understand our words.
Below are 3 nicely formatted storage events:
| Event 1 | Event 2 | Event 3 |
| Index = storage | Index = storage | Index = storage |
| Time = 2019-08-05 00:00:00 | Time = 2019-08-05 00:10:00 | Time = 2019-08-05 00:20:00 |
| StorageServerName = EU_1 | StorageServerName = EU_1 | StorageServerName = EU_2 |
| CapacityUsedGB = 550 | CapacityUsedGB = 600 | CapacityUsedGB = 990 |
| CapacityTotalGB = 1000 | CapacityTotalGB = 1000 | CapacityTotalGB = 1000 |
It should be clear from these events what the fields mean. For example, notice that Event 3 is about a server called EU_2, and around 20 past midnight this storage server had only 10 GB available space. We are now capable to give meaning to these events, like we give meaning to sentences with words in a particular order.
What more is there to the collecting of data? Be careful when ingesting data, since besides creating nice events you need to think about other factors as well. For example, how do you handle duplicate or missing data? And is it easy to combine this data with other types of data? Have you thought about cleaning data (for example, transforming “---$X$ 5 AUG 19 10.00 $X$---" into “Time = 2019-08-05 10:00:00”)?
Also think about error handling, licensing, security, documentation, etc…
As you can see, collecting data into a data lake is no easy task. However, by iterating on it step by step you will end up with a mature product. Just like raising a child until it reaches adulthood.
2. Data usage
Back to the baby-example: when it is able to make sense of the world, you can now interact with it. Or to put it in business language: you now have a well-structured data lake and are ready to discover insights and deliver value – for example create a prediction for capacity management.
First of all, you need to check if you have all the information you need. For example, from the compute data you can see how many physical hosts there are, where they are located and how much CPU and Memory they consume. But you can’t see which Virtual Machines are on them. This can be because you forgot to collect this data, in which case you should go back to the previous step, just like children who sometimes have to repeat a class because they forgot to study. Or the sources of the collected data aren’t linked yet. In practice this often is a difficult step, as registration systems are not always completely up to date, have missing fields or follow a different structure. Once you have figured out how to combine all the data together, you are ready to generate value and insights from the data.
 Compute capacity alert
Mostly, you start by creating a dashboard. This is useful to validate the data, as well as broadening the understanding of the data. Together with your customer you think of what visuals might help in determining capacity risks quicker. It might take a while to get it right, as often it is hard to define in advance which results will help most.
When dashboards are in place, it is time to advance to the next phase. Like a child goes from primary school to secondary school and then possibly university. In business, this means answering more difficult but important questions to obtain more valuable results. For capacity planning, it is important to order new equipment before reaching unstable levels. Because we need to prevent a bad situation from happening, a scheduled report or alert works much better than a static dashboard. Since if nobody looks at the dashboard the bad situation can be missed completely, whereas an alert is always triggered at the right time. In order to determine when to order new equipment, we need to make calculations based on supply and demand. The challenge is that supply and demand are often incomplete and very volatile, meaning that we should use smart algorithms to find a practical solution. Also, the interoperability of the entire stack makes it quite hard to alert correctly and in time on when and what to order.
Alerting already adds value, but there is still more value to be gained. Capacity management is something that should be planned, instead of treated as trying to prevent incidents. This makes predictions of the future necessary. Not only predictions to define when to order new hardware, but also about dividing load across systems, looking at spare parts, indicating where there is still free space, and redistributing clusters in order to save cost. This already helps to prevent problems before they would pop up, and simultaneously saves money by using a smart allocation of resources. Just like young adults balance their time in order to be healthy, complete their study, go out with friends and have fun.
The final step is to create some form of automated capacity planning. Long before there is a capacity risk, it should be automatically checked if there are spare parts available that can support a predicted new load, or if re-balancing might solve the issue. If this is not the case, then a new order will be created automatically, and a alerting mail is sent to an engineer, including a report for the engineer to approve or decline. Humans should never be phased out completely, as capacity management mistakes can cost large sums of money. Despite their usefulness in the modern world, always be careful with fully automated algorithms .
Conclusions
I hope this blog explained how Data Scientists transform data into value based on this IT Stack example. But as you might have noticed from the introduction, the most value that can ever be produced from all kinds of different data, is you!