Itility analytics on data from the Storm motor
August 14 marked the kick-off of a groundbreaking tour: in 80 days around the world on an electric touring motorbike. This motorbike (STORM WAVE) is the first electric touring motorbike – designed and built by 23 students from Eindhoven University of Technology (TU/e). Besides the mechanical and electronic challenges involved in developing an electric motorbike, there is also a digital component for collecting, saving and analyzing all the data from the motorbike.
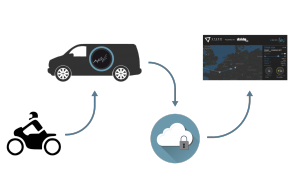
Various sub-components of the STORM WAVE have sensors that collect this data and send it to one of the support cars. An NXP Vehicle-to-Vehicle solution is used for this. There’s also a real-time internet connection via KPN 3G, which allows the engineers to keep up with the status of the motorbike.
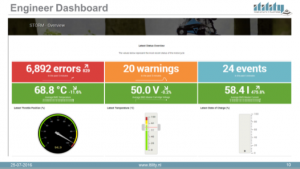
The data collected by the sensors in the motorbike (over 200MB per hour) is processed and presented to the STORM engineers in the support car, for whom Itility has built an action-focused dashboard. The dashboard shows the “health” of the motorbike and its various components, and filters the multitude of messages to focus on the real errors requiring direct action. This results in higher safety levels and allows preventive maintenance, adjustments and optimization to be carried out.
At the end of the day’s journey, all this data is sent via a regular internet connection to the Itility Managed Analytics Platform (IMAP), where it is combined with other data sources (including route and weather data).
 Our data scientists use the data for carrying out analyses, in order to optimize performance and consumption, for example. We have also developed self-learning algorithms for predicting the travel time, describing relationships between weather conditions and battery life, and analyzing driving behavior, etc.
In order for everyone, everywhere to follow the STORM World Tour, we have developed an app that showed where STORM WAVE was driving, where they were headed, 3 latest STORM tweets and more information.
First data Itility hackathon | Weekly blog Dataconomy
Building the “follow-STORM” app has turned data into an experience, a true digital transformation challenge. With thousands of visitors each day, performance is important. Hence we used Load Impact for performance/load-testing. Take a look behind the scenes of the follow.storm-eindhoven app by clicking on the button below.
Read more about the collaboration between Itility and STORM in the articles below (in Dutch).


