Wageningen University Research (WuR) has developed a machine for rapid plant phenotyping that is capturing the plants’ observable characteristics. This machine (called the MARVIN3D) uses multiple cameras to capture each plant from multiple angles and additionally creates an 3D-model of the plant.
It is used to select – in an early stage – which seedlings will grow into successful plants. With the challenge of feeding a growing population with less resources such as land and water, early selection of the best plants helps to focus effort and resources on those plants that are bound to be successful.
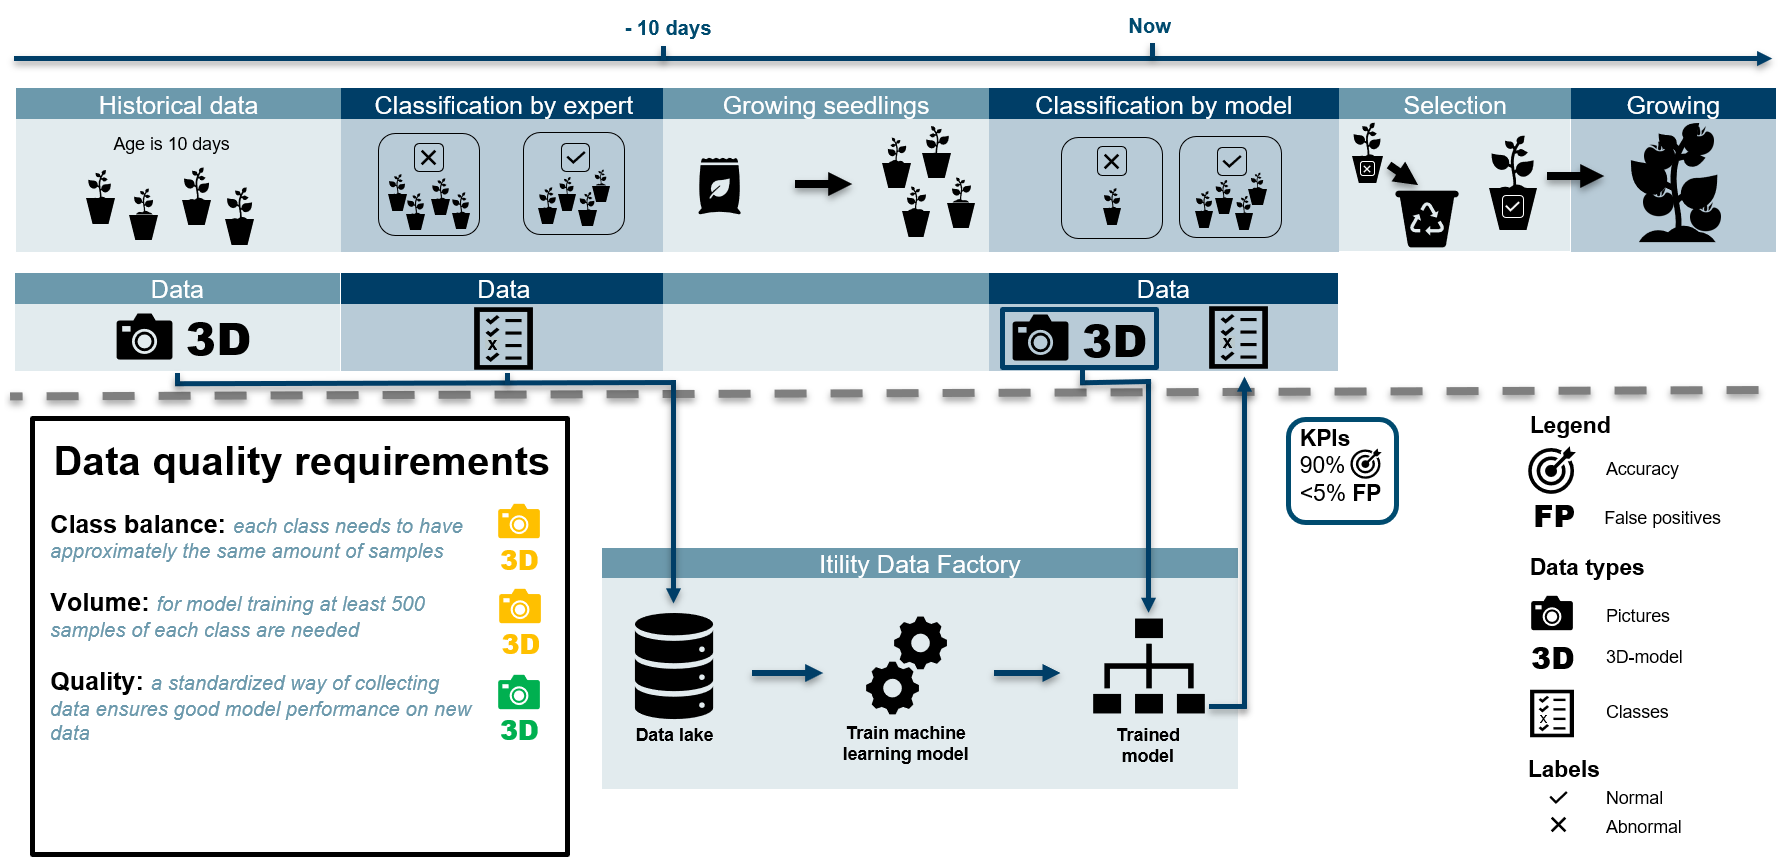
We developed an analytics solution to aid the selection of seedlings of tomato plants. It can classify tomato seedlings at the age of ten days into normal and abnormal plants. We do this using a machine learning approach to find patterns in the data that are linked to these plant classes. The input for the model is a combination of the images, the 3D-model and parameters derived from the model, such as the number of leaves and the stem volume.
Data wise, the biggest challenge in this use case is class imbalance. To reliably determine the class of a seedling, the data for training the machine learning model should have approximately the same number of plants for both classes. However, in reality the number of abnormal plants is much lower than the number of normal plants. Class balance can be improved by using data from a tomato race that is more prone to abnormality. Also, data augmenting techniques are used to slightly alter the images before the model ‘sees’ them, to imitate more variety in the abnormal seedlings. In addition, we tuned the model to be more sensitive for incorrectly classifying abnormal plants.
The model reduces manual classification labor; it results in a faster, more objective way of classifying normal and abnormal seedlings. Also, it improved the agreement between seed breeders and seedling growers on the quality of seed and resulting plants.
Not only for tomato plants, but across the entire horticulture sector, quite an efficiency can be gained by using images to automate visual inspection of plants – whether that is to define the quality of a plant, to detect diseases, or to predict ripeness.