If you don't try you will always miss
Modern sports heavily rely on statistics. Alongside trainers, physiotherapists and doctors, data analysts have become a vital part of a sports team. They collect and analyze data gathered during training and competitions to uncover patterns and variables which help sportsman reach best results. In team sports (football, volleyball or basketball) this kind of insight is most beneficial.
At the recent hackathon we gave our participants a possibility to become such analyst, evaluating Kobe Bryant's 20-year career to find out from which angle he has the best shot accuracy.
Participants were given a dataset containing records of all shots Kobe Bryant ever attempted (whether successful or not) – an impressive number of over 30.000 shots. Each shot was described by 25 features like type of shot (action type), distance from the target, name of the opposing team, position on the field, etc. Plus a field with the result of the shot – with 4.500 shot attempts for which the outcome was not labeled.
The challenge? Teams were asked to provide success probabilities of the non-labeled shots. In addition: find out from which angle Kobe had the most shot accuracy. The quality of the scoring was measured using a log loss and the shot accuracy using our famous applause meter.
This meetup we were happy to welcome many young and curious adepts of data science ready to put their skills up for a challenge. To make sure they could make the best of the evening they were paired with more experienced participants.
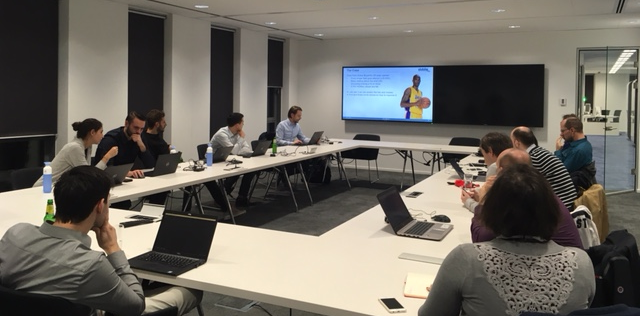
 Teams are preparing for the challenge
Visualization
As the challenge started and I made my first round across the room, I noticed that most of the teams took a similar approach and diversified their resources. And so, part of each team focused on visualizing data at hand, whereas the others started to develop a model. The idea was that the visualization may provide some insight into how to improve the model, by pointing to the variables of the highest relevance.
Analytics tools used included Python plotting packages (matplotlib), Pandas library, as well as Splunk. However, no matter which tool was used, it all painted the same picture: action type was the most predictive variable and a short distance from the target increased Kobe’s chance to score.
Data preparation
As for team members who were responsible for model building they all started by cleaning their dataset. Most of the teams removed all non-predictive variables such as game_id and shot_id. One of the teams was so effective at it that they run their model with only one variable: action type. While indeed that variable had the most predictive value (one team estimated it at 31%), by itself it wasn’t sufficient to accurately predict success of a shot.
 Analyzing the variables like shots by action type and shots by opponents
Others tried to expand their dataset by creating derived variables, such as 'games played in the last 14 days'. At the same time, they reduced the number of categories by aggregation. Unfortunately, this approach proved to be too ambitious for such a short time.
Another team took a very systematic approach of analyzing each variable’s relevance using caret package in R. This approach resulted in 0,607 log loss score, good for a very proud second place!
Building a model
When it came to building the model, most of the teams relied on simple, effective solutions, such as linear regression, XG Boost and/or random forest. No matter which approach was chosen, action type always stood out as a variable of highest relevance with dunking shot being the most successful type of shot.
 The winning team got an impressive 0,6 log loss score, however many teams were right behind them with score differences in far decimal points. The “if you don’t try you always miss” was among the most impactful and relevant advise, and it not only applies to basketball!


