On Thursday March 16th Itilians Lars Bergh and Stef Schepens gave a guest lecture at Maastricht University for an elective subject called “Data fusion”.
"In this lecture, we aimed to give students a practical understanding of how data fusion and data science can be applied in real-world contexts, by providing examples from our Demy product. At the conclusion of the presentation, we introduced a real-life data fusion case study that students will have the opportunity to work on in the coming weeks. This hands-on project will give students the chance to apply the concepts and techniques they've learned in class to a real-world problem, and deepen their understanding of the power of data fusion in solving complex challenges."
What is Data Fusion?
Data fusion is the art of combining multiple sources of information at multiple levels of abstraction in a model to come to a decision. There are three different levels of data fusion.
- Low-level fusion (Signal-level fusion)
- Mid-level fusion (Feature-level fusion)
- High-level fusion (Decision-level fusion)
Low-level fusion
In low-level fusion, raw signals are combined into new signals that can be used to get to a result. An example of this would be stitching together 2 images of an object into a single image and training a neural network on the newly created images. Here, all raw pixels of both images are combined into one image, on which the model trains.
Mid-level fusion
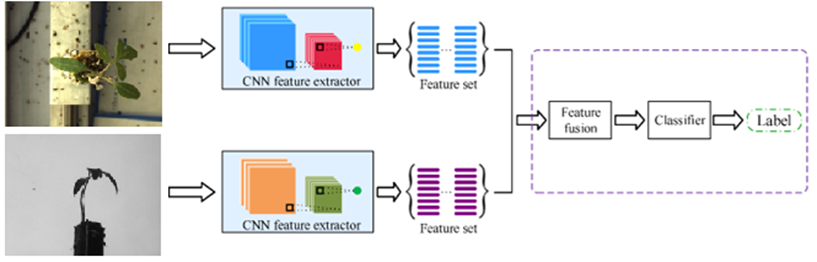
When utilizing mid-level fusion, we first extract features from the data, and then we combine them to create higher level features that result in the final model. The most straightforward example comes from computer vision, where convolutional operations are used to extract features from an image. The following image demonstrates an example of feature fusion, where features obtained by convolution are combined into a single classifier to output a label:
High-level fusion
The use of high-level fusion is probably the most intuitive to explain. In high-level fusion, separate models are trained, but their outcomes are combined or averaged into a single result. This is best illustrated by a binary classification model that has a probability as an output. Averaging the two probabilities of the two models results in a final probability that gets assigned to one of two classes.
The case
After the guest lecture, a real-life case computer vision case was introduced on which the students could apply their learnings about data fusion. The goal for the assignment was to use at least 2 data fusion techniques when building models that could classify a plant as either “good” or “bad” – and to do that as accurately as possible. The dataset contained pictures of 1000 plants with a top view and a side view, as can be seen below:

Each of these plants was rated (labeled) by 4 experts on a scale of 1 to 4:
1: Very good
2: Good
3: Abnormal
4: Not sprouted
The students were tasked to come up with a strategy to merge the experts' opinions into a single "good" or "bad" label, and then to apply data fusion to generate accurate results from various models. They documented their findings and reasoning, and presented their results in both written reports and 5-minute pitches.