Our country is rich in knowledge about data, technology, and innovations. And this high-tech knowledge is beginning to find its way into the agricultural sector too.
Nowadays, Dutch agriculture fully embraces the possibilities of new data technology: from autonomous sorting solutions to the digital mapping of plots, plants, animal behavior, diseases, and pests.
In addition, automation and robotization contribute to solutions for well-known social problems: the availability of sufficient (qualified) labor, product quality, and the environment. But how do you set this type of innovation in motion?
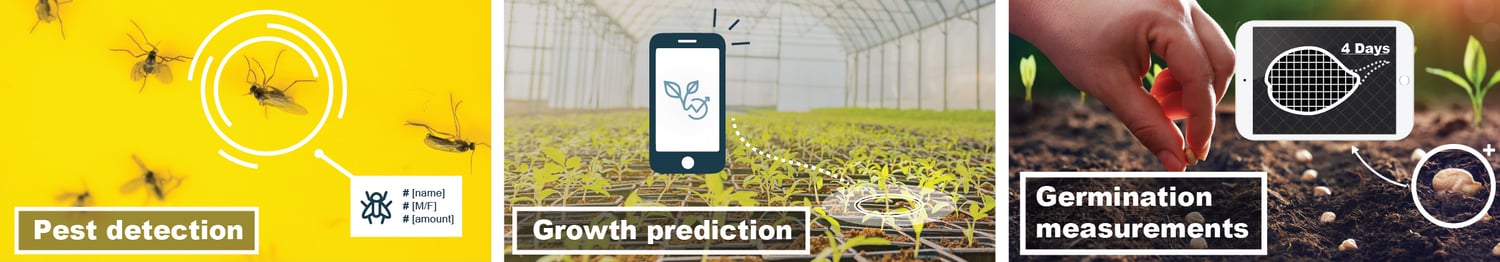
A good example of the use of data technology is employing image recognition algorithms to gain insight from photos — whether they were taken with your phone’s camera or with an advanced spectral camera. Consider taking a photo of a fly trap to automatically count the number of flies and determine the species; and compare these numbers with those from the week before. This allows you to discover, or even predict, pests in your greenhouse. Or using photos to determine the length of a plant and then compare it to the average length of the entire batch. But also, automatically counting the number of germinated seeds to obtain figures on germination rate and vitality.
Innovating with sensors and algorithms
We have tested the above examples together with growers. Furthermore, we strongly believe in our own innovation. So, we combined our high-tech experience, machine learning knowledge, and software skills into a model, also called a ‘digital twin’, to grow lettuce fully autonomously.
How? We have converted plant-growth models from mathematical formulas to data science code. We use this to generate a recipe for the greenhouse: how high should the temperature, CO2 levels, and humidity be at what time of the day for the lettuce to grow optimally? To continuously optimize this, the model needs data on the dry weight of the plant during the growth cycle, which we calculate automatically using pictures of the side and top of the plant. With this optimal recipe, we adjust the sensors of the climate chamber to exactly the right settings.
Combining data collections
But a lot can be achieved, even without cameras and extra sensors. Your current dataset is therefore a good starting point. Smarter usage of data that is already being collected is often an eye-opener that can give insight into possible new use cases; a nice and relatively simple first step in agriculture innovation. Use your harvest data, data from the climate computer, and factors like water consumption, CO2 levels, and temperature. We used this kind of data, combined with data on when pesticides were applied, to predict mildew on strawberries six days before actually appearing in the greenhouse, with an accuracy of more than 70%.
The sorting computer also generates data about each product that leaves the greenhouse. And we have data on the spraying schedule, which resources (and when, where, and how much) were used, the logbook that includes who harvested which crop, and so much more.
When you approach cultivation challenges from a data perspective and when you connect data flows based on that, solutions arise in places you probably had not thought of before.