
The real worth of something can only be determined by putting it to the test by trying or using it: the proof of the pudding is in the eating. In our Proof of Value approach that goes the same: the value of the use case can only be determined if it is running in day-to-day operations. Whether that value is to auto-detect issues in manufactured goods or to enable more focus on root cause analysis of first-generation products in order to increase time to market or to enable making complex planning decisions.
In my previous blog about ‘The proof of the value is in the data’ we discussed a method to choose those data initiatives that bring the highest value. The next step is to build data pipelines in a short time (pressure cooker approach) to actually prove the value of that data use case.
It is a good start if you can show value from data on a one-off basis. However, it is much more powerful to bring recurring value to your day-to-day processes. That is why ‘operationalizing’ is important as a selection criterion when ranking different data initiatives in your organization.
So, what is a data pipeline than can deliver this operational value and how to build one as a robust and sustainable solution?
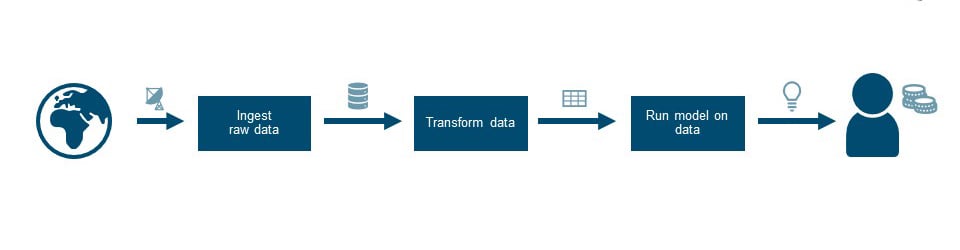 Schematic representation of the data pipeline
The above flow shows a simplified view of the data pipeline. You start with raw data, process it and at the end of the pipeline, there is an end-user who is helped with data insights that are of value. Some examples of value we have seen before include: a planner who needs help with complex planning decisions, a support-engineer who wants to know when a machine breaks down, or a marketeer who wants to understand how to sell better.
To deliver such insights, you need a (data science) model that does something smart with data. In general, data is messy, and the raw data coming from ‘your world’ needs to be transformed toward a structured version. Before that, the data needs to be ingested in some way. It sounds simple, but there can be quite some challenges in getting from A to B.
First things first
When we start with a pressure cooker project, we begin with defining the prerequisites that need to be in place. Depending on your organization, this can include things like data access, user accounts, firewall changes, time from domain experts, etc. Those generally can be found by brainstorming with the team and the domain expert. These are the first actions to which you need to start giving attention. Small tip: keep a list of these items, as well as any others you encounter later on. This can really speed up future projects.
One lesson we quickly learned is that in such pressure cooker projects, it is difficult to plan a sprint. There are quite a large number of unknowns that you only uncover when you start. So, what we do is draw a schematic representation of the data pipeline and use that to mark our unknowns and progress. With parts that seem risky or challenging, we start to work removing uncertainty. In some cases, this uncertainty is the challenging nature of raw data (lack of completeness, difficult structure or binary formats). In other cases, it is part of the processing where a specific technology with which we are inexperienced (e.g. domain-specific data modeling tools).
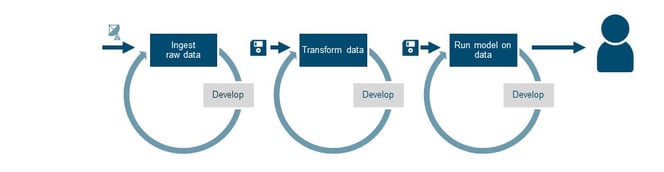
Starting to develop the data pipeline
The schematic processing pipeline serves as a to-do list. Depending on the size of the team, we work in parallel on various aspects of the pipeline. One team member works on the raw data ingest from other systems, while another member works on a first data dump (the floppy in the visual) to transform the data. The goal of the first sprint is to show that all steps are working separately, while preferably including a first demo of what the end-user is going to see; a Minimal Viable Product (MVP). Or in terms of our Proof of Value approach: the Minimal Valuable Product.
Having the first parts of the pipeline working gives the team the right boost of confidence that things can be done. It still involves some serious effort and optimism to see a full operational workflow, but after one or two weeks it’s time for a first demo. The demo shows the (business) stakeholders that progress is being made and that value is being delivered.
Connecting the dots
The next sprint goal is about connecting all separate parts. With the data ingestion working, the results can be put in the right place (e.g. database or a file system). The code that was developed to transform the data dump can be connected to the ingested data. Generally, this is a minor step. But, with real (or new) data coming in, the model should be (re)tested with the end-user. Are the insights still correct when looking at real data? Does the user recognize the insights based on the fresh data?
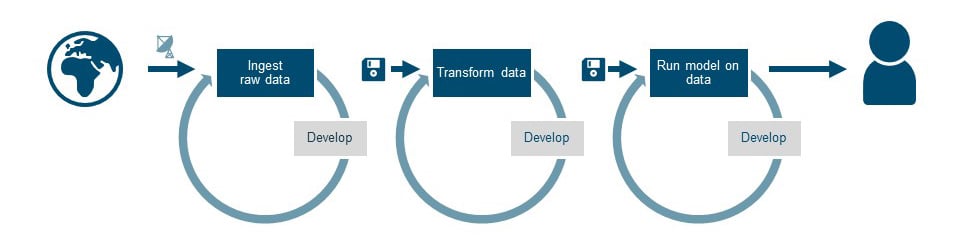 Connecting the separate parts
Demo-ing the pipeline with the ‘connected dots’ sometimes makes the stakeholders believe ‘it is almost done’. “Aren’t you showing the end-result already?” It is important to do some expectation management, as we still have some hurdles left to overcome. This is not yet an operational workflow, as it still involves manual steps, and the incoming data is not processed automatically just yet. In other words, there are still important parts missing before this is a sustainable solution.
Making it reproducible
The sustainable solution needs to cope with a changing world. Data changes, requirements change, and users want new insights. The only way to keep managing the pipeline in the future is when you’re able to deploy it automatically from a source code repository using Continuous Integration and Deployment (CI/CD).
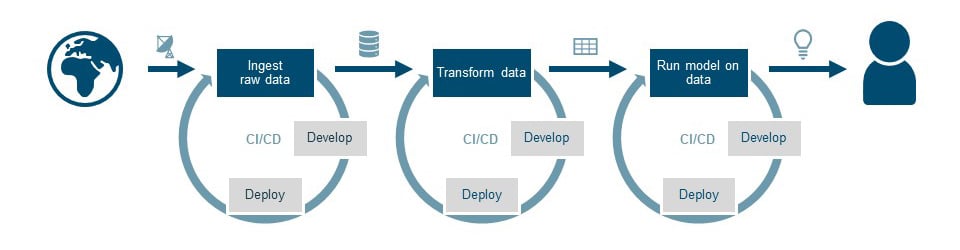 Automated deployment added to the pipeline
As soon as the developed code is deployed to a data platform (inside your organization or in the cloud), the development loop is closed. Any changes to the software will result in a new version of the production system. All versions of code and models will be kept as history. However, the pipeline does not keep running by itself, so the next step is crucial in making it fully operational.
Scheduling the solution
Deployment of code is one aspect of a successfully managed pipeline. The next is scheduling all pieces. In most cases, data pipelines do not run just once. To deliver weekly, hourly or even real-time value every step needs to be scheduled. Generally, there are two possibilities: a time-based schedule or an event-based schedule (processing based on incoming data).
 Job scheduling added to the pipeline
Based on the time schedule or events, data will now automatically flow from the ‘world’ towards insights for the user. The pipeline is creating recurring value.
Taking it fully operational
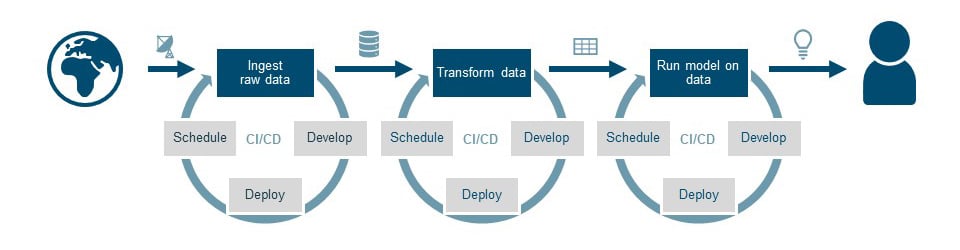
There is one more step for successfully running a data pipeline to keep it creating value. Pipelines are built ánd maintained in DevOps teams. Drink your own champagne: the team is responsible not only for the development of a pipeline but also for running the pipeline 24/7. The final piece needed is a way to monitor all parts of the pipeline for quality, completeness, and problems. In the visual, this is indicated by the cameras on top of the processing steps.
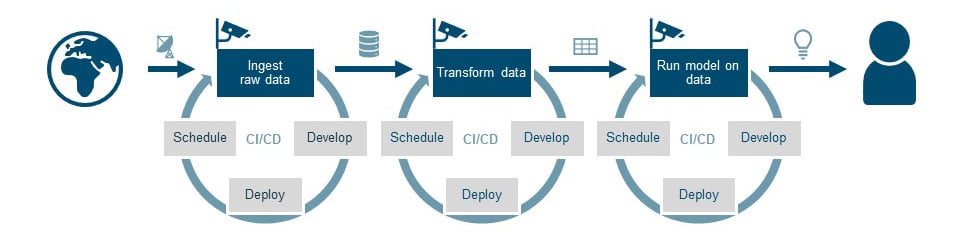 Monitoring added to the pipeline
How we stay agile
Our pressure cooker projects have taught us that a traditional agile approach like Scrum does not always help in keeping speed. So for our Proof of Value project, we use an agile approach where we place the data pipeline in the middle. We draw out the data pipeline schematically and mark our progress on each ‘block’. This helps explain the necessary data steps to the team and all stakeholders. Also, it clearly indicates what steps we need to take get to an operational solution. For us, this is the perfect balance between process and results.
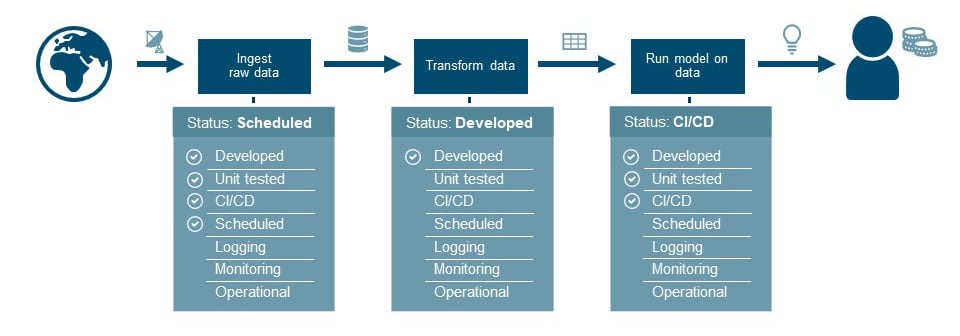 Example progress report
Stay tuned
Proving the pudding: delivering results quickly and operationalizing value on a day-to-day basis can be done via the pressure cooker data pipeline approach. It is all about starting early with the most challenging parts and growing toward a sustainable and operational data pipeline. Keep breaking the work down into small steps to make it tangible and show a taste of the value along the way.