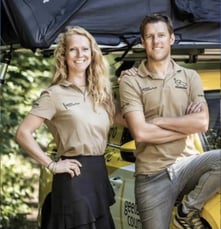
 Driving from the Netherlands to South-Africa and back fully electric to set an example for others in living more sustainably – that’s the mission of Renske and Maarten in their 4x4 Electric expedition. A mission that we as Itility strongly value and want to contribute to. Therefore, we visualize their journey through a dashboard and interactive maps and tools, enabling them to share it with the world and get more attention for their cause.
Making an impact by doing
Renske and Maarten are on a mission to inspire and assist people in living more sustainably without compromising their quality of life. With their electric car, a custom EV including integrated solar panels, sensors, and strengthened parts for rough terrains, they travel through Africa, share success stories on sustainability, aim to provide valuable insights, and inspire others to find their own sustainable paths.
The dashboard
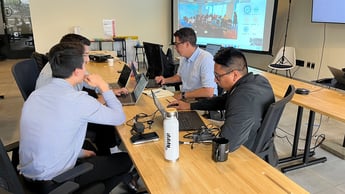
To visualize their entire journey, we created an interactive dashboard and integrated it into the 4x4 website, using a combination of tools like Databricks, HTML, CSS, and JavaScript. Each day, we collect data of the car’s battery and GPS sensors, and automatically turn it into interactive route maps and real-time information on battery levels, altitude, and temperatures. In order to create a holistic view of the expedition, we also included highlights and fun facts based on the data. This way, everyone can follow the journey closely and stay engaged.
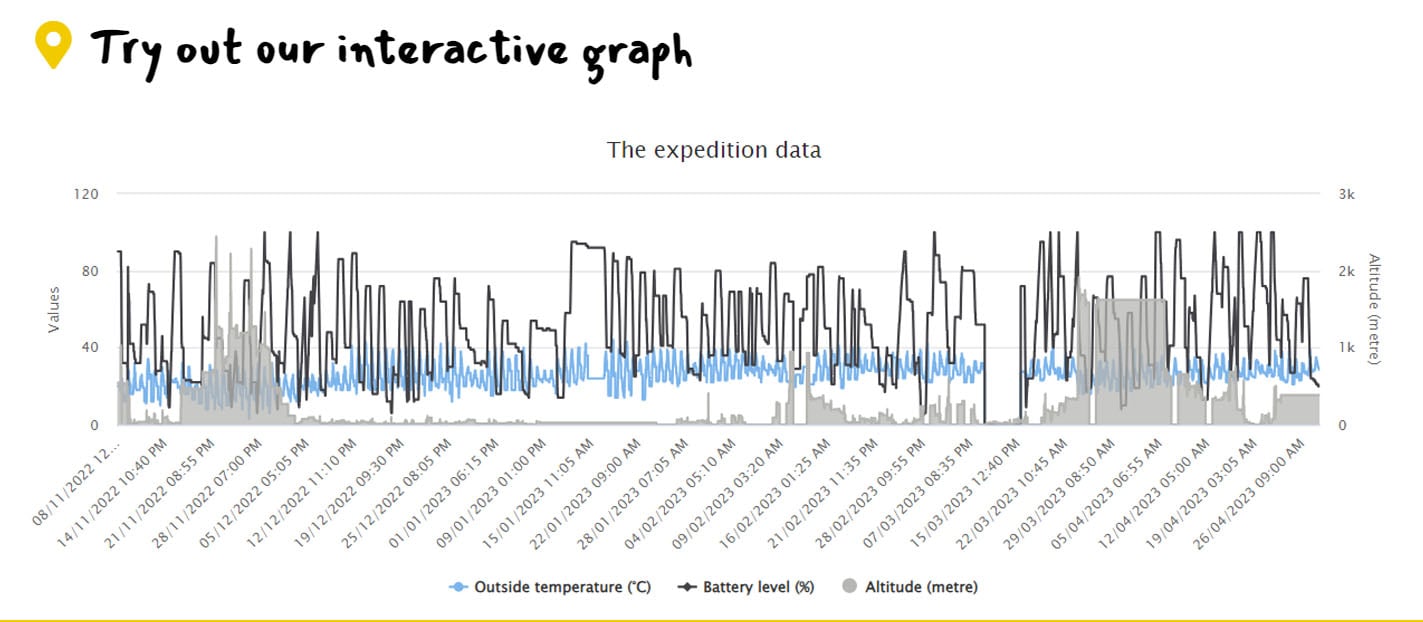
Note: click the image above to visit the interactive dashboard page.
The metrics & country page
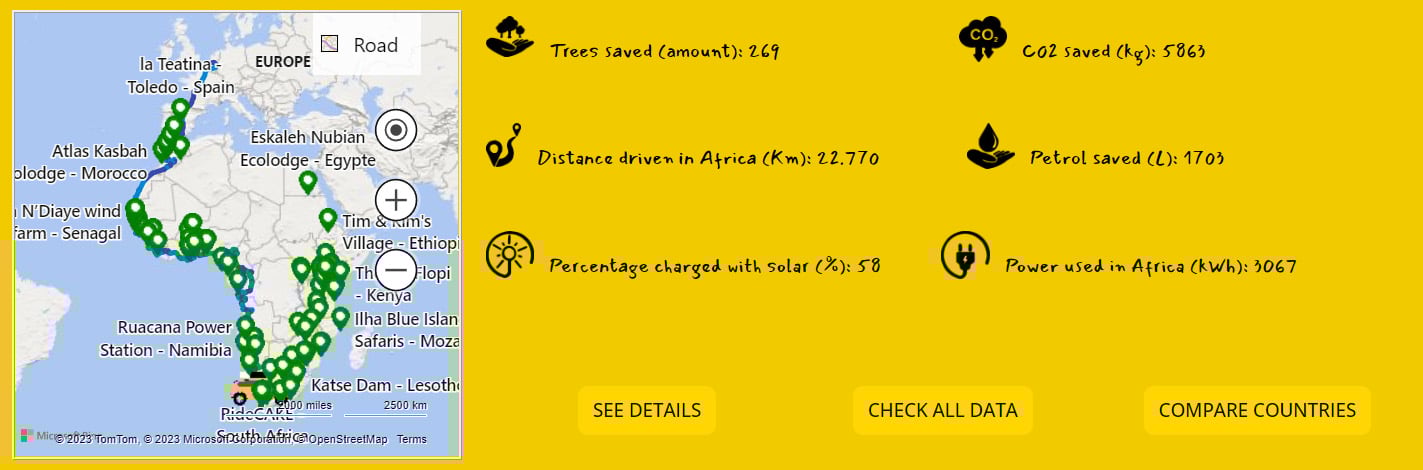
In addition to the dashboard, we created metrics and a country page. The metrics consist of raw data that is converted into interesting information for a website visitor. Think of looking at the saved petrol, and converting this to saved CO2 (in kgs), and even saved trees.
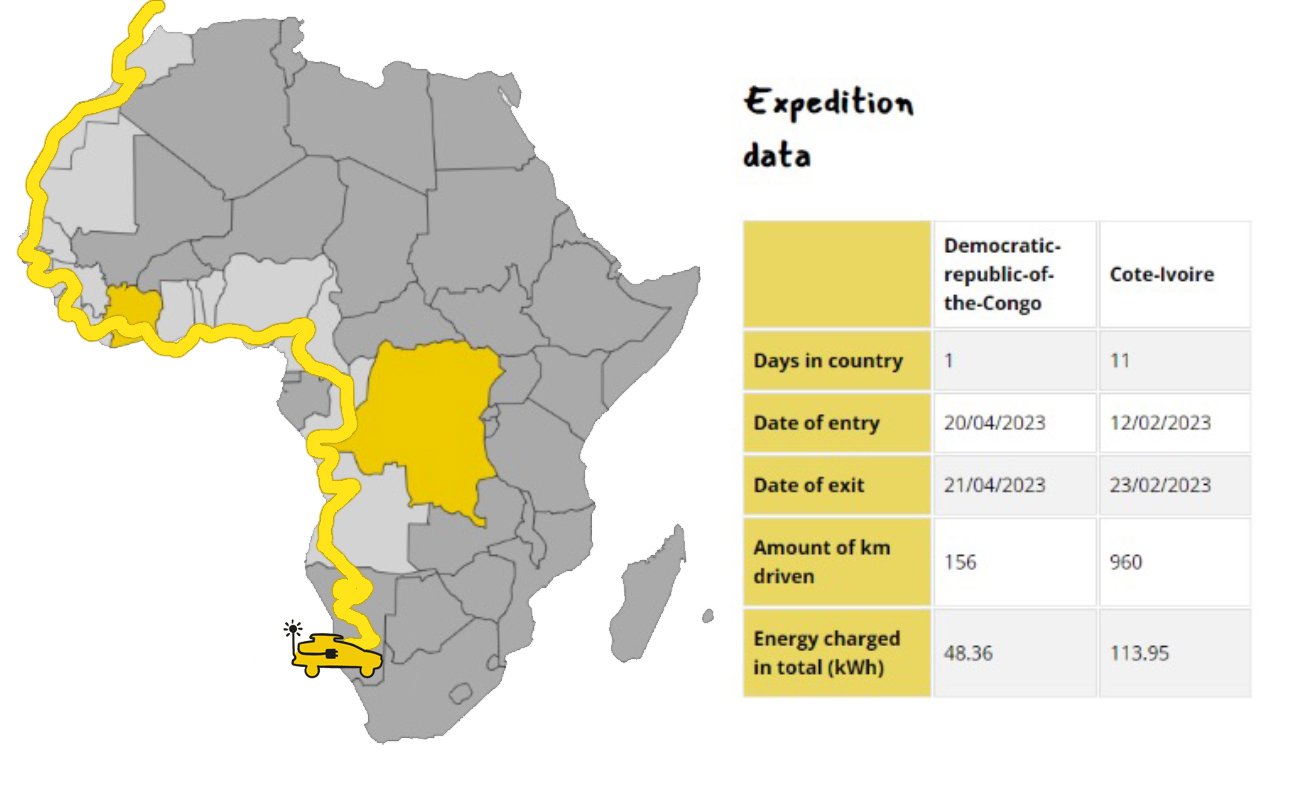
Then there is the country page – it shows an interactive map of Africa, and allows visitors to compare sustainability-related data of different countries (such as how much of the car’s energy is generated by its solar panels).
Upcoming
Currently, we’re working on a cool new feature: a weekly quiz. We use this form of gamification with the aim of increasing the user engagement and impact of the expedition. Curious about the quiz or the expedition? Subscribe for the newsletter or visit https://4x4electric.com to stay updated.